Every executive team investing in AI eventually faces the same question from the board, from investors, or from themselves: is this actually working?
The problem is not that AI lacks value. The problem is that most organizations measure AI initiatives the way they measure software projects -- by tracking adoption, activity, and feature delivery instead of economic outcomes. This creates a measurement gap where teams report progress while leadership cannot connect AI spend to business results.
This framework gives executive teams a practical, repeatable way to measure AI ROI without requiring a data science team to build custom models.
Why traditional ROI methods fail for AI
Standard ROI calculations work when inputs and outputs are clear: spend X, receive Y. AI initiatives break this model because:
- Value often compounds over time rather than arriving in a single event
- Benefits frequently appear in one function while costs sit in another
- Efficiency gains are real but hard to convert to dollars without headcount or throughput changes
- Avoided costs and risk reduction are invisible in most financial reporting
- Attribution is shared across multiple systems and process changes
When leadership applies traditional ROI thinking to AI, the result is either inflated claims that nobody trusts or understated returns that kill promising programs too early.
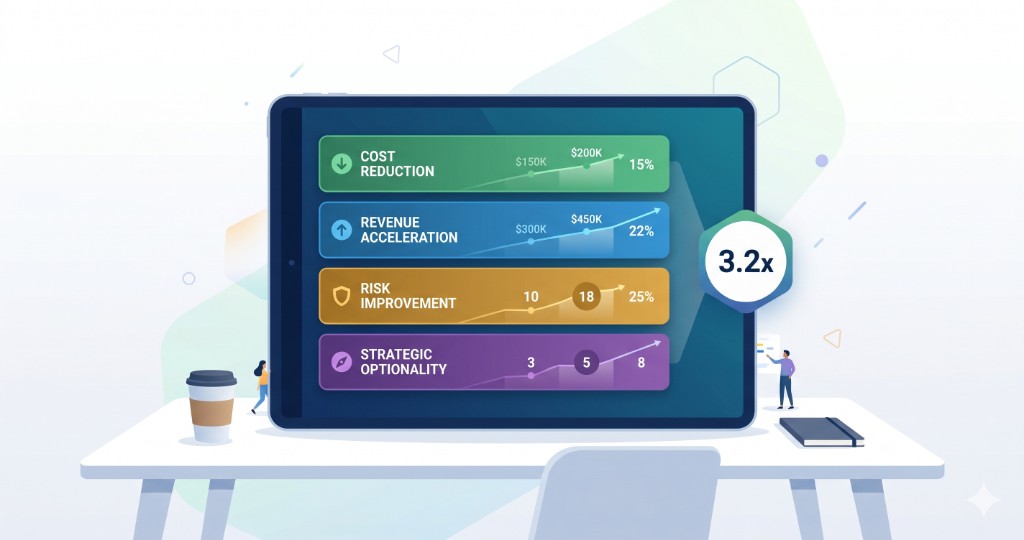
The four-layer AI ROI framework
Measure AI value across four layers, each with increasing strategic impact:
Layer 1: Direct cost reduction
The most visible and easiest to measure. Look for:
- Labor hours eliminated or reallocated to higher-value work
- Vendor or tool costs replaced by AI-driven automation
- Error remediation costs reduced through AI quality checks
- Processing time improvements that reduce operational cost per unit
How to measure: Compare the fully loaded cost of the process before and after AI, measured monthly. Include transition costs in the first-year calculation.
Layer 2: Revenue acceleration
Harder to isolate but often the largest value driver. Look for:
- Sales cycle compression from AI-assisted qualification and prioritization
- Conversion rate improvements from AI-driven personalization or scoring
- Expansion revenue from AI-identified upsell and cross-sell signals
- Faster time-to-market for products or features using AI development tools
How to measure: Track cohort-level metrics. Compare outcomes for AI-assisted deals, campaigns, or product launches versus non-assisted baselines over the same period.
Layer 3: Risk and quality improvement
Often overlooked because avoided losses do not appear on income statements. Look for:
- Churn reduction from AI-powered early warning and intervention
- Compliance cost avoidance from automated monitoring and flagging
- Forecast accuracy improvement reducing inventory waste or resource misallocation
- Security incident reduction from AI-assisted threat detection
How to measure: Establish baseline loss rates and quality metrics before deployment. Track deviation quarterly. Assign economic value to each percentage point of improvement using historical loss data.
Layer 4: Strategic optionality
The most valuable and hardest to quantify. This layer captures capabilities that AI creates for the business even before they generate direct returns:
- New product lines or services only feasible with AI infrastructure
- Data assets created through AI operations that appreciate over time
- Competitive positioning advantages from AI-enabled speed or personalization
- Talent leverage -- ability to grow output without proportional headcount growth
How to measure: Track leading indicators quarterly: new capabilities shipped, data assets created, output-per-employee trends, and competitive win rate against non-AI-enabled competitors.
Building the AI ROI scorecard
Combine the four layers into a single-page quarterly scorecard for leadership review:
| Layer | What to measure | Baseline | Current | Annualized value |
|---|---|---|---|---|
| Cost reduction | Operational cost per unit | Measured at launch | Updated monthly | $ saved annually |
| Revenue acceleration | AI-assisted conversion or cycle time | Pre-AI cohort | AI cohort | $ incremental revenue |
| Risk and quality | Loss rate or error rate | 12-month historical avg | Post-AI avg | $ avoided loss |
| Strategic optionality | New capabilities, output per head | Pre-AI baseline | Current trajectory | Qualitative + leading $ |
The total AI ROI is the sum of annualized value across all four layers, divided by total AI investment (tooling, compute, integration, and allocated team time).
Common mistakes that distort AI ROI
- Counting time saved without verifying reallocation: if AI saves 10 hours per week but those hours are absorbed by lower-value tasks, the economic benefit is zero
- Using pilot results to project enterprise returns: pilots operate with high attention and clean data -- scale introduces friction that reduces unit economics
- Ignoring integration and maintenance costs: ongoing compute, model updates, data pipeline maintenance, and change management are real costs that erode gross returns
- Measuring adoption instead of outcomes: high usage of an AI tool means nothing if the business metric it targets is unchanged
- Declaring ROI too early: many AI benefits take 2-3 quarters to stabilize -- premature measurement captures noise, not signal
The 90-day measurement kickstart
For teams that have not yet established AI ROI tracking, start here:
- Week 1-2: identify the top 3 AI initiatives by total spend. For each, name the primary business metric it should improve.
- Week 3-4: establish baselines for those metrics using pre-AI data. If no clean baseline exists, start measuring now and accept a delayed comparison.
- Week 5-8: instrument tracking so each metric updates at least monthly without manual effort.
- Week 9-12: run the first quarterly scorecard review. Identify which layers are producing value and which are not yet measurable.
After the first cycle, the scorecard becomes a standing item in quarterly business reviews.
Questions boards and investors will ask
What is our payback period on AI investment?
Calculate cumulative Layer 1 and Layer 2 value by month. The month where cumulative value exceeds cumulative AI spend is your payback point. Most well-targeted AI initiatives reach payback in 6-12 months.
How do we know AI is not just shifting costs?
Track total output and quality alongside cost metrics. If costs drop but output or quality also drops, the initiative is cost-shifting, not value-creating. True ROI requires stable or improved output at lower cost.
Are we spending the right amount on AI?
Benchmark AI spend as a percentage of revenue against industry peers. More importantly, measure the ratio of AI value generated to AI spend. A healthy ratio is 3:1 or higher by the second year of deployment.
What happens if we stop investing?
For each major initiative, estimate the reversibility cost: what capability, efficiency, or competitive advantage would degrade, and how quickly? This frames AI investment as ongoing operational infrastructure, not a one-time project.
Final thought
AI ROI is not a single number. It is an operating discipline.
Teams that measure consistently across cost, revenue, risk, and strategic value make better investment decisions, earn board confidence, and compound their AI advantage faster than competitors who treat measurement as an afterthought.
Start with the three initiatives that matter most. Measure what they actually change. Build from there.
Be the first to share your thoughts.